Every panel, under control.
We monitor heat pumps, HVAC units and air-conditioning systems in real time, detecting wear signals and anomalies before they cause a system shutdown.
WHY MONITOR
A drop in performance isn’t visible to the eye.
A dirty panel, an inverter in fault or a partially shaded string reduce production without anyone noticing, until the bill is checked. Continuous monitoring spots the issue the same day, not at the end of the quarter.
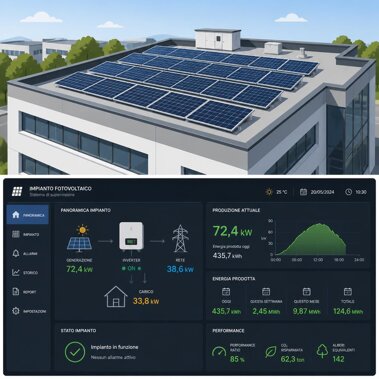
Real time
Production monitored minute by minute
Per string
Accurate diagnosis, not only at the plant
Anywhere
Dashboard from PC, smartphone and tablet
WHAT WE MONITOR
Four areas of action.
From overall energy production down to the single string, leaving nothing to chance.
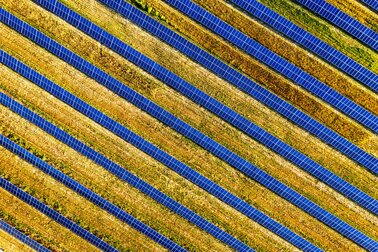
01 - PRODUCTION
Energy production monitoring
We monitor in real time kWh produced, irradiance and performance ratio of the plant, comparing expected values with actual ones to identify deviations.
- Instant and historical production
- Comparison with expected theoretical production
02 - INVERTERS AND STRINGS
Status of each inverter and each string
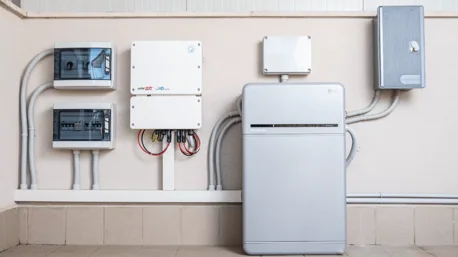
Data collected at single-inverter level and, where possible, at single-string level: we immediately identify which part of the system is underperforming, without having to inspect everything.
- Targeted diagnosis per string/inverter
- Inverter error history and diagnostic codes
03 - ANOMALY DETECTION
Performance drops reported automatically
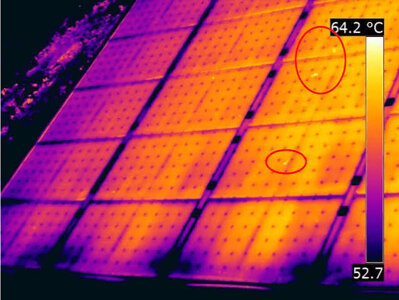
The system continuously compares actual output with expected output based on irradiance and weather conditions, reporting anomalies and performance drops as soon as they occur.
- Automatic notifications on performance drop
- Distinction between weather-related cause and plant-related cause
.jpeg "images (1).jpeg")
04 - REPORTING
Energy dashboards and reports
Periodic reports on production, energy savings and return on investment over time, also useful for reporting and incentives.
- Exportable monthly/annual reports
- Full history for multi-year analysis
EXPECTED RESULTS
Maximum output, minimum reaction time.
01
Maximized
yield
We act as soon as a drop in performance is detected.
02
Faults identified
early
String-level diagnostics, not just plant-wide.
03
Protected
investment
Ongoing reports to show performance over time.
Let’s talk.
Do you want to understand how monitoring your photovoltaic system works?
d